 Enodo QuickTake
- Our estimates show expected credit losses climbing to between 20% and 27% in 2021
- The necessary clean-up will exact a heavy toll on the economy, reinforcing our view of lengthy stagnation ahead
- It is premature to get excited about China's equity markets even on a cyclical basis despite the authorities' efforts to lift investor spirits
We combine bottom-up analysis of China’s quoted sector with a top-down macro evaluation of the returns on credit to estimate expected loan losses following the post-GFC borrowing binge. The number we arrive at for 2021 is 20% of GDP, using 2021 credit data and 2020 figures for impairment rates.

But 2020 benefitted from a cyclical decline in loan impairment rates as was the case in 2017. When we get the data for the loan impairment rate for 2021 later this year, it's likely to show a decisive reversal. Using the loan impairment rate for 2018 which was a difficult year, but not as tough as 2015, pushes our estimate of credit losses to 27% of GDP.
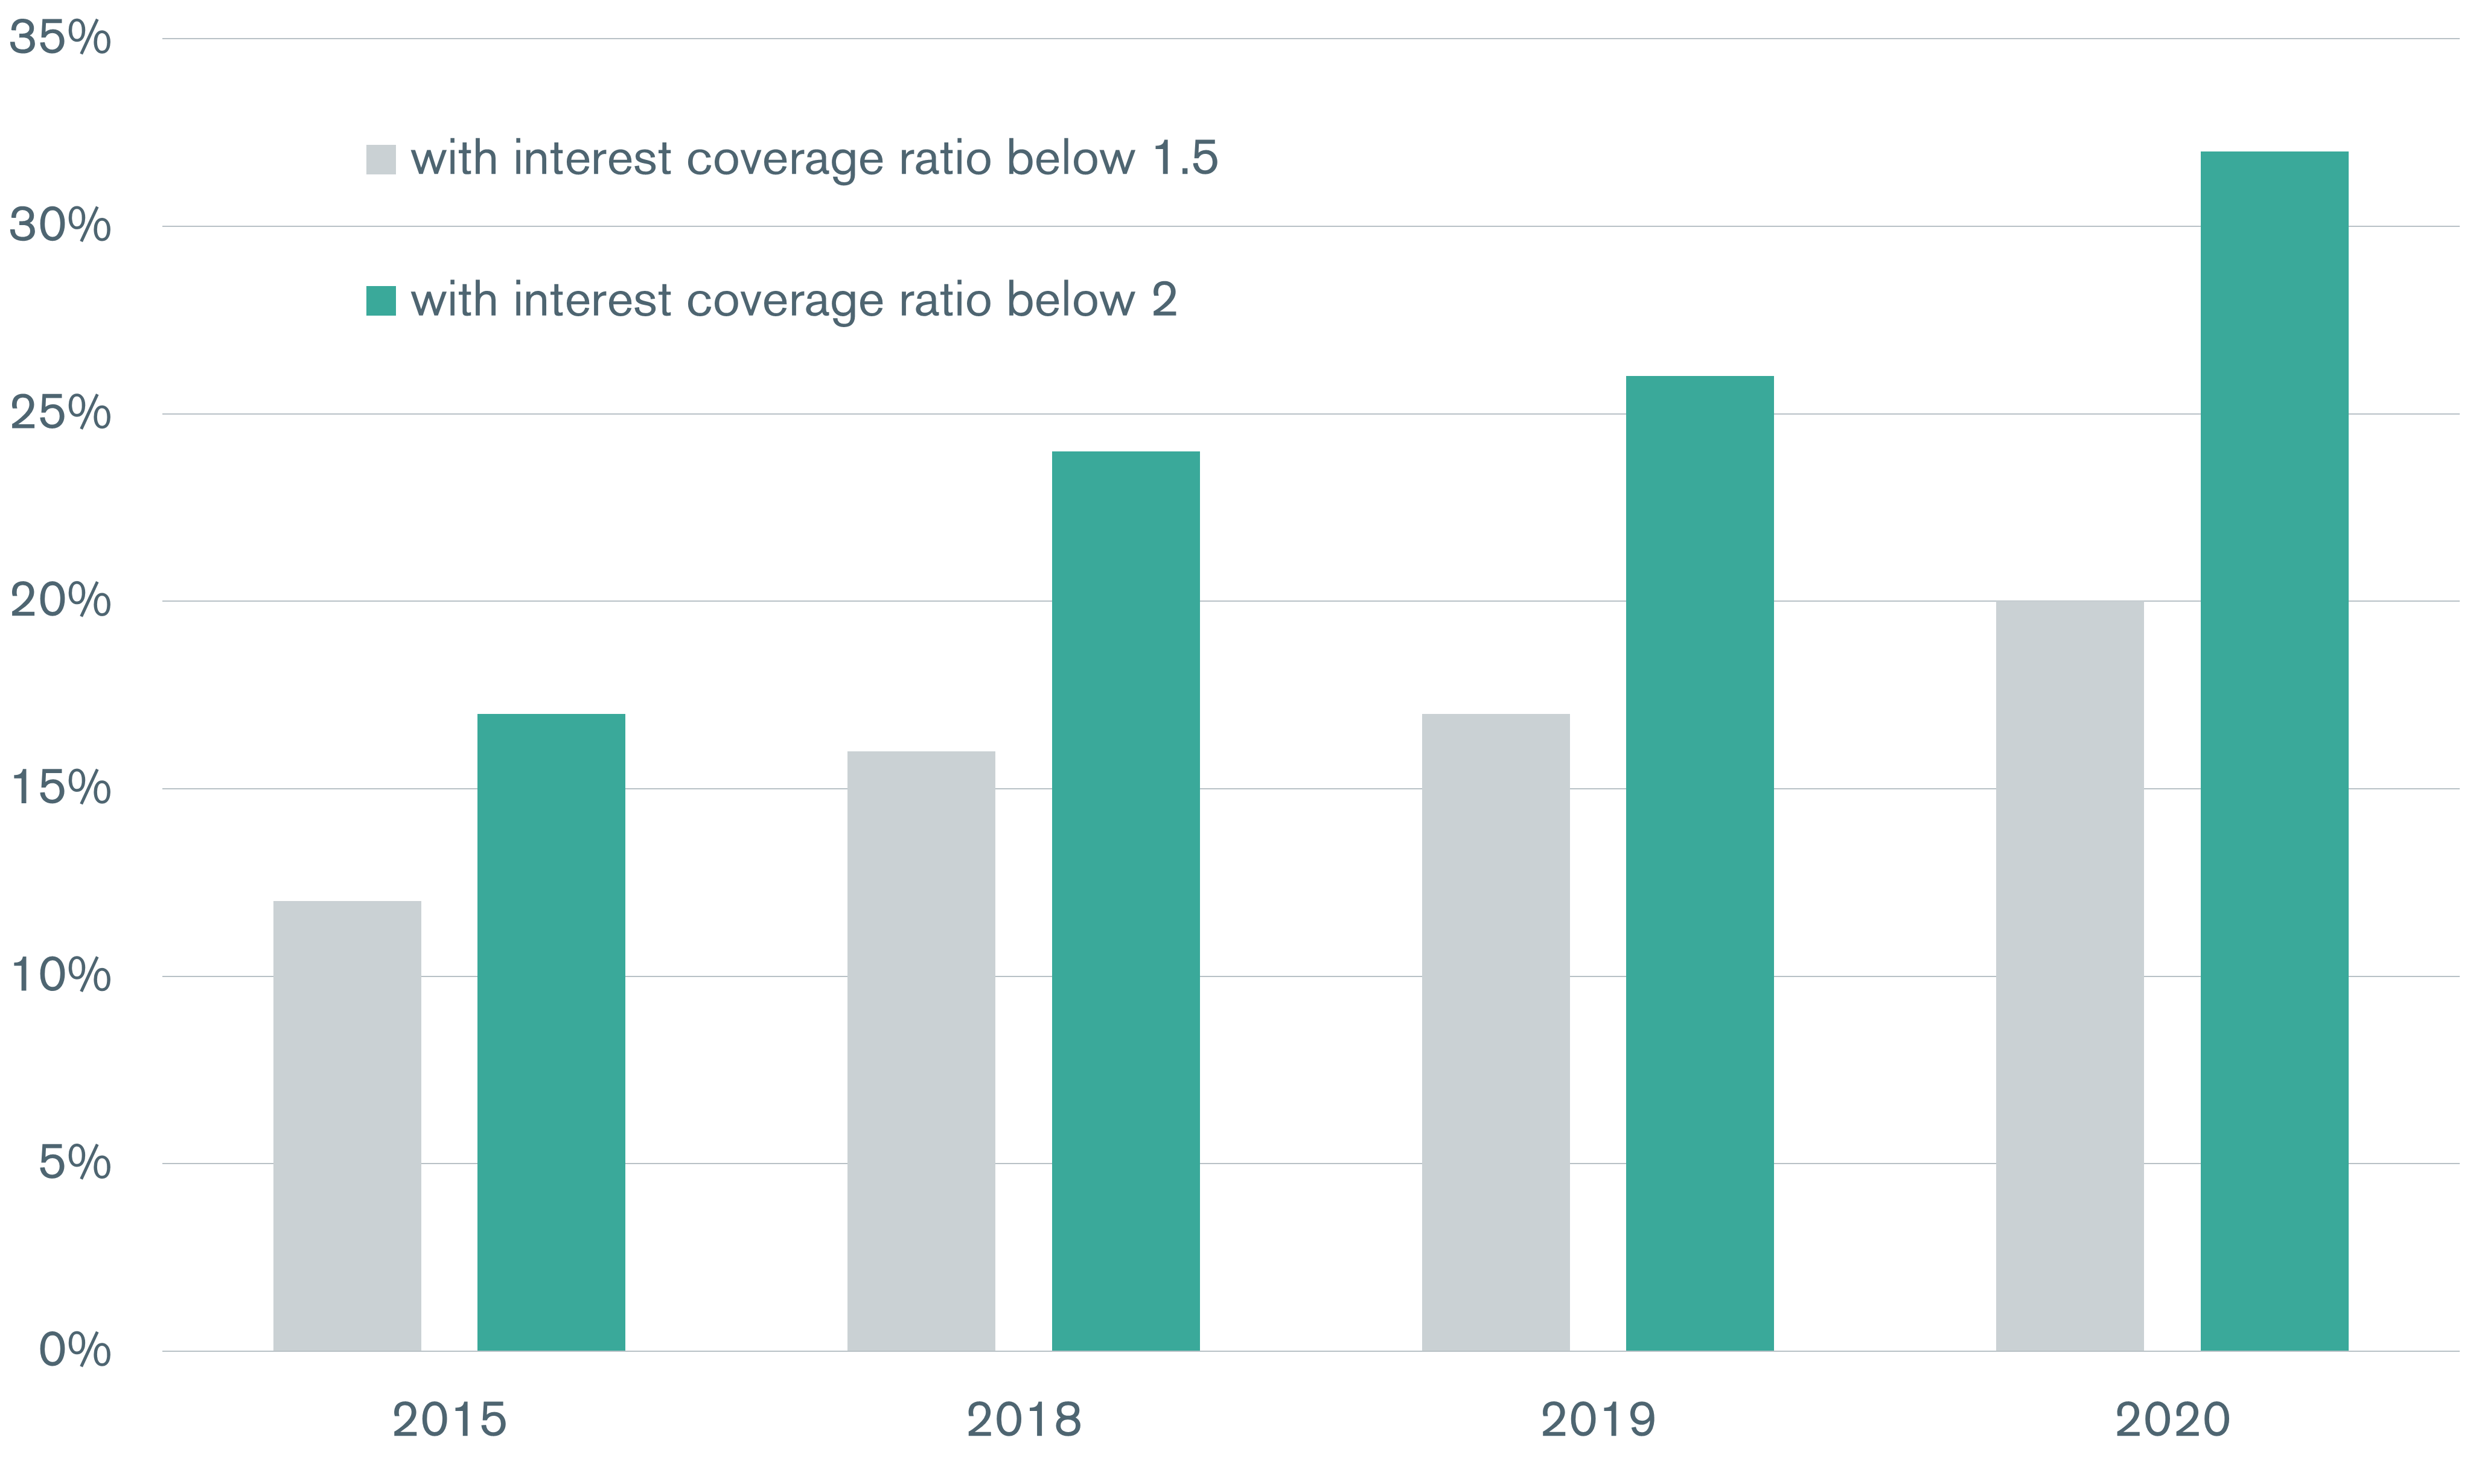
We have been conservative and based our estimates on the share of loans to firms with an interest coverage ratio of 1.5 times to total loans. The respective impairment rates and credit loss estimates surge to scary levels if we are to use an interest coverage ratio of 2 times. And if for 2021 we apply the 2018 loan impairment rate, our estimate of credit losses in this scenario would jump to 41%.
Before Covid-19 hit, I argued that even if we double the estimated credit losses (at that time at 19% of GDP on our headline estimate which has since been revised to 17%) a jump to around 40% of GDP would be drastic but just about manageable. The data we now have two years after the pandemic has confirmed my suspicions that Covid-19 acted as an accelerant, leaving the authorities with little, if any room, for manoeuvre.

This is far from great news, both in terms of the economy and China's equity markets, to put it mildly.
See below for a short explanation of our methodology.
There are five steps to our methodology.
First, we estimate the average GDP return on credit over the period 1985 to 2004. We chose 2004 rather than 2008 as the cut-off point because on our estimates that was when China’s overinvestment started. The return on credit was 0.80, meaning one additional dollar of credit boosted GDP by 80 cents.
Second, we calculate the implied amount of credit used to generate GDP in 2005-2021 at a return of 0.80.
Third, we compare the actual amount of credit with the implied amount of credit in that period. The difference is how much credit is potentially unproductive.
Fourth, we apply an impairment rate to the estimated total of unproductive credit to obtain the amount of bad debt. The impairment rate is calculated using firm-level data from Wind for China’s quoted sector in 2020. It is defined as the share of loans to firms with an interest coverage ratio of 1.5 times to total loans. The interest coverage ratio is earnings before interest and tax divided by interest payments. This proxy for the impairment rate comes out at 14%.
Fifth, the total of impaired credit is multiplied by a loss ratio. Conservatively, the ratio we use is the cash recovery rate of 0.2 based on available CEIC data on China’s asset management companies.
Credit loss table
| Credit to all sectors (non-financial corporations, households & the government) | |||
| Historical period spans from 1985 to 2004 | |||
| Unproductive credit | Rmb, Billions | ||
| a. GDP return on credit (1985-2004) | 0.80 | ||
| b. GDP increase between 2021 and 2004 | 96,844 | ||
| c. Amount of credit used to generate this GDP at a return 0.80 (b/a) | 121,580 | ||
| d. Actual credit extended from end-2004 to end-2021f | 322,093 | ||
| e. Implied excess (unproductive credit) (d-c) | 200,513 | ||
| f. - share of 2021f outstanding credit (f/d) | 58.0% | ||
| - share of 2021f GDP | 177.5% | ||
| Impairment and loss rates | |||
| a. Impairment rates2 | 14% | 23% | |
| b. Unproductive credit | 200,513 | 200,513 | |
| c. Amount of impaired credit (a*b) | 29,061 | 45,259 | |
| d. Loss rate (1- recovery rate1) | 0.79 | ||
| e. Estimated loss (c*d) | 23,099 | 35,973 | |
| f. - of which banks' share | 19,115 | 29,768 | |
| g. Estimated loss in % of 2021f GDP | 20% | 32% | |
| Existing buffers in the economy | |||
| Banking capital as of Sept 2021 | |||
| - Commercial bank: net capital | 26,450 | ||
| - Commercial bank: net capital: Tier 1 capital | 21,673 | ||
| Fiscal scope | |||
| - Government debt in 2021f (in billions) | 77,895 | ||
| - Government debt in 2021f (% of GDP) | 68.9% | ||
| 1 we use cash recovery ratio for conservative purposes 2 impairment rate of 14%/23% corresponds to the share of firms (IRC data) with an interest coverage ratio (IRC) below 1.5/2.0 | |||